
Last Updated November 2026
Introduction
The ST segment and T wave are where the ECG shows ischemia, injury, electrolyte problems and brain catastrophes. They are also where most of the normal variants live. This post covers the basics: how to measure the ST segment, how to read its shape, and how to size up the T wave.
1. The ST Segment and the J Point
The ST segment is the pause between ventricular depolarization (QRS) and repolarization (T wave). Electrically it should be quiet, so it should sit on the baseline.
It runs from the J point (where the QRS ends) to the start of the T wave. Both ends can be fuzzy, so treat the length as an estimate.
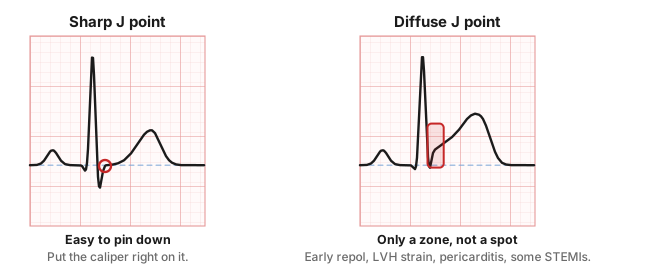
- Sharp J point: a clear corner between the QRS and the ST. Most ECGs look like this.
- Diffuse J point: the QRS curves smoothly into the ST. Seen with early repolarization, LVH with strain, pericarditis, and some STEMIs (especially "tombstones").
2. Measuring ST Elevation and Depression
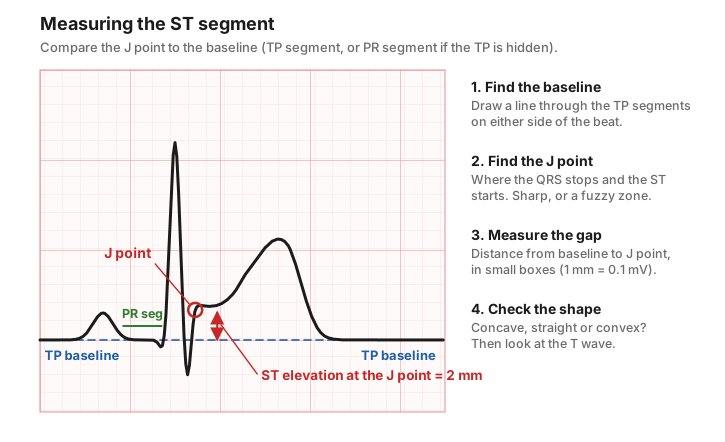
- Find the baseline. Use the TP segment (end of T to the next P). A clear ruler or straight edge helps.
- If the TP is hidden (fast rates, where T and P run together), use the PR segment instead.
- Find the J point and measure how far it sits above or below the baseline. 1 small box = 1 mm = 0.1 mV.
How much elevation is normal?
Leads | Upper limit of normal J-point elevation |
All leads except V2–V3 | < 1 mm |
V2–V3, men ≥ 40 | 2 mm |
V2–V3, men < 40 | 2.5 mm |
V2–V3, women | 1.5 mm |
For depression, the Fourth Universal Definition of MI treats new horizontal or downsloping ST depression of ≥ 0.5 mm in two neighboring leads as an ischemic change.
Core Principle: Numbers are a starting point, not a verdict. Any ST elevation that is new compared with an old ECG, or that fits the patient's story, can be pathologic. Garcia's motto: judge it by "the company it keeps."
3. ST Segment Shapes
Once you know how much, look at what shape. Some shapes lean benign; others should make you stop.
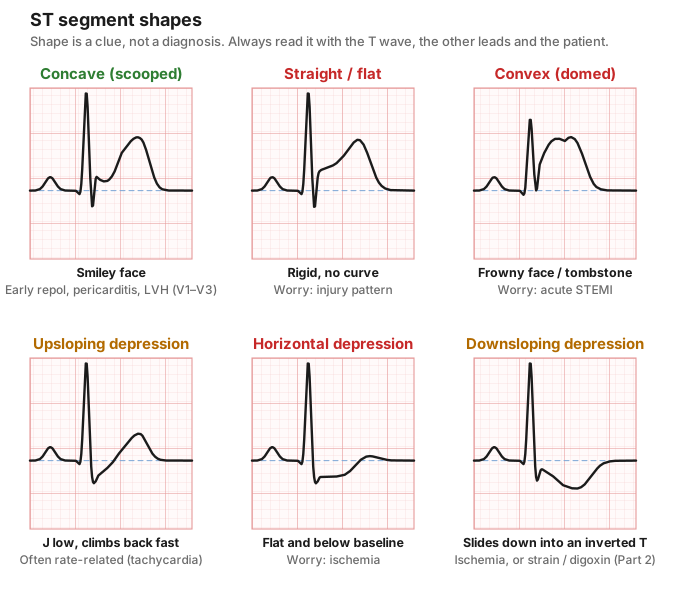
Shape | Looks like | Think |
Concave up (scooped) | A smile | Early repolarization, pericarditis, LVH in V1–V3. Usually benign, but not always. |
Straight / flat | A rigid ramp or shelf | Injury or ischemia, especially if new |
Convex (domed, coved) | A frown; merges into the T as a "tombstone" | Acute STEMI until proven otherwise |
Upsloping depression | Low J point that climbs quickly back to baseline | Often rate-related (tachycardia); less specific |
Horizontal depression | Flat, below the baseline | Ischemia |
Downsloping depression | Slides down into an inverted T | Ischemia; also strain (see LVH) and digoxin |
Pearl: Ischemic ST changes tend to be flat and to come with symmetric T waves. Benign elevation tends to be concave with asymmetric T waves.
Examples: ST Shapes
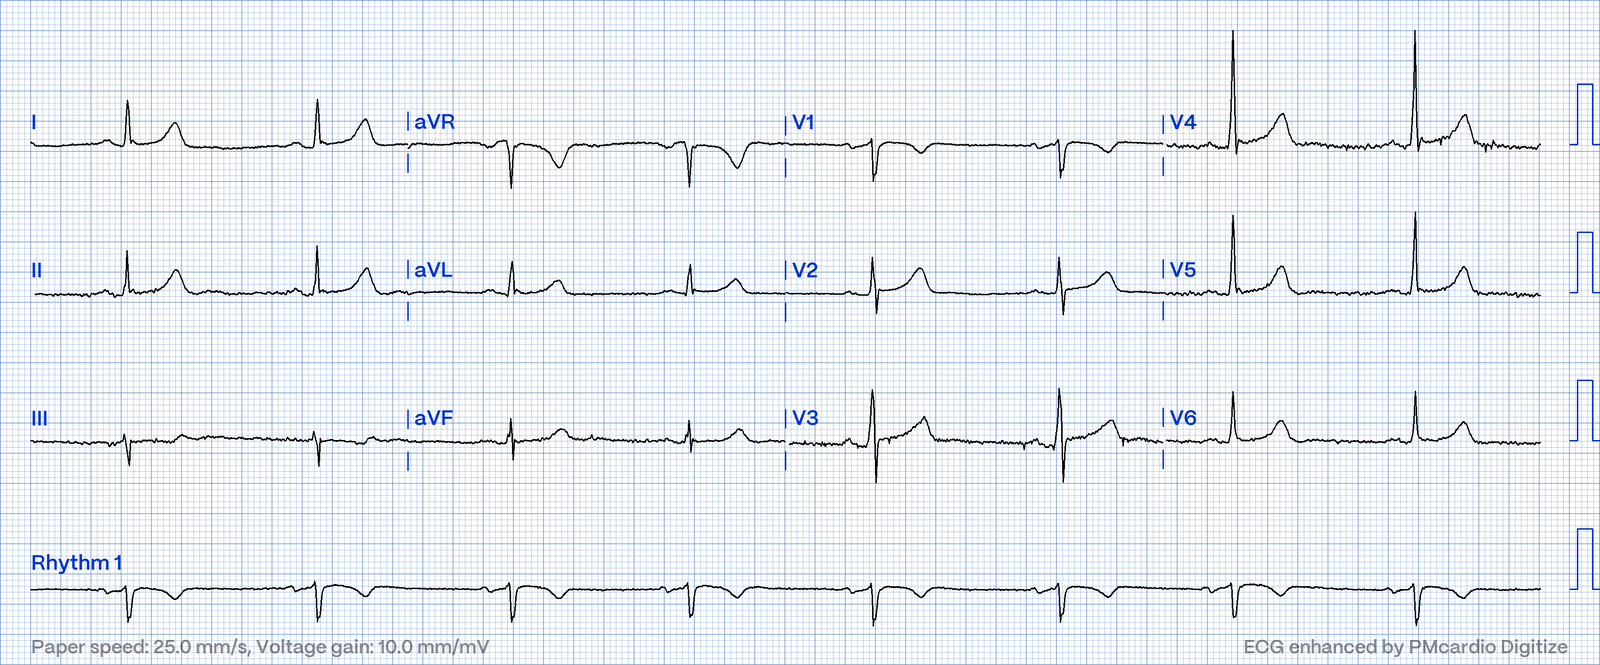
Concave (scooped) elevation: early repolarization. 28-year-old. The ST smiles up into a tall, asymmetric T.
Convex elevation: Anterolateral MI
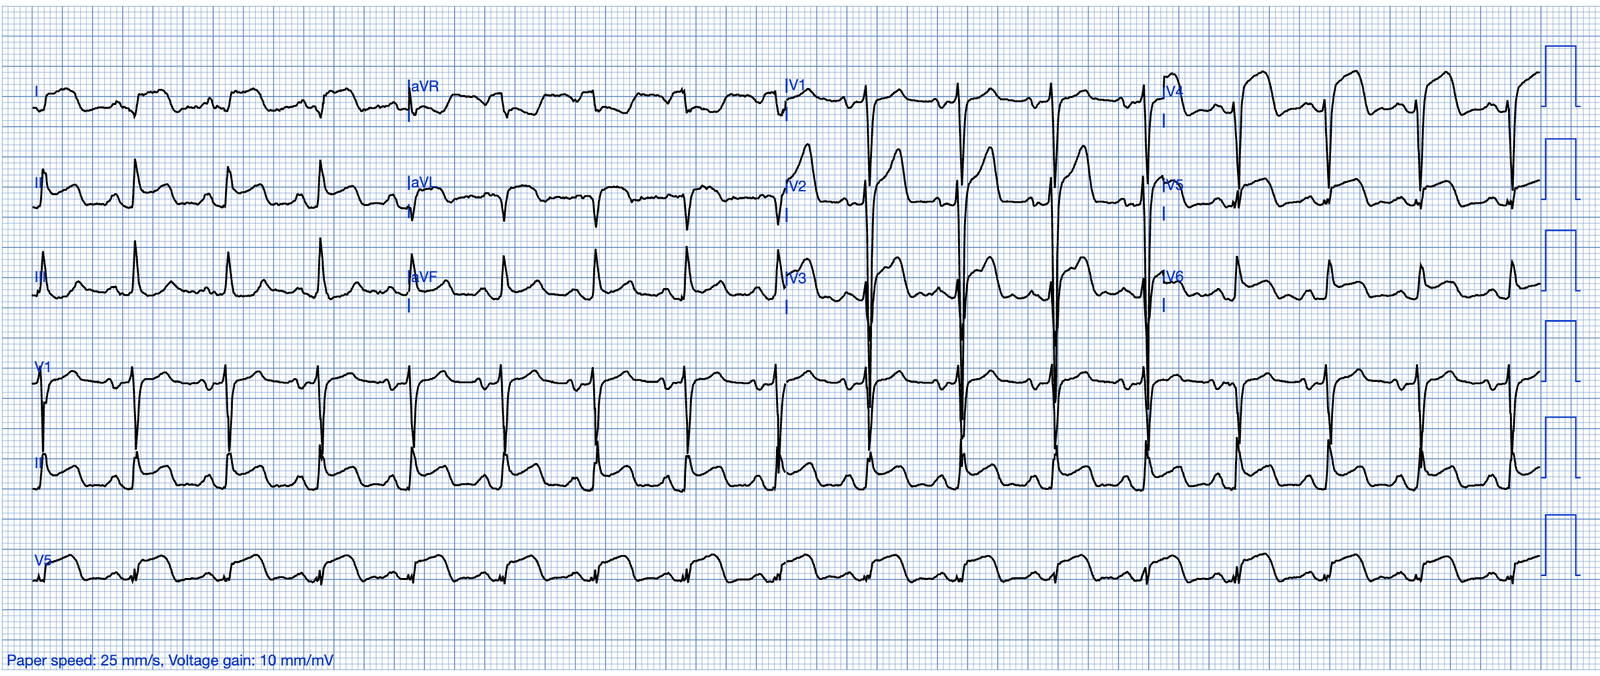
Convex elevation at its most extreme: the "shark fin." The QRS, ST and T fuse into one giant wave in the anterolateral leads. No old ECG needed for this one.
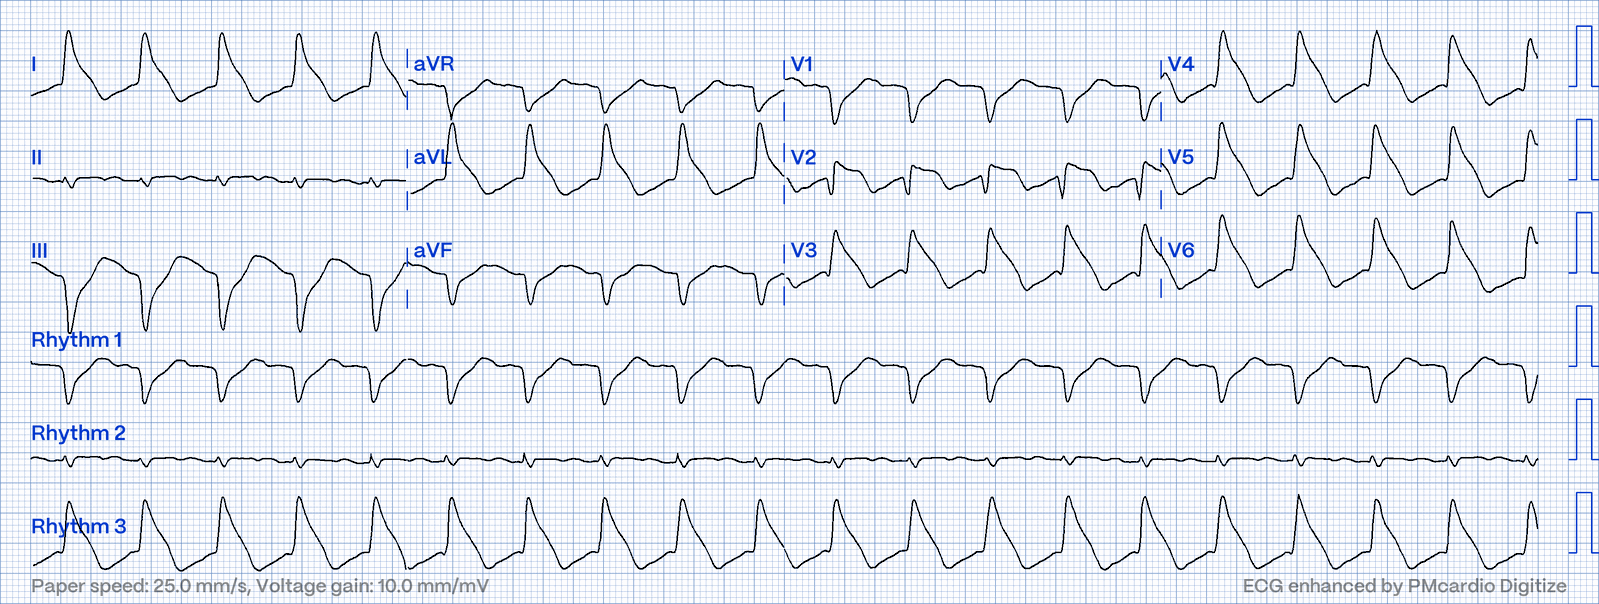
Horizontal depression: ischemia. Flat ST depression that turned out to be an D1 stenosis.
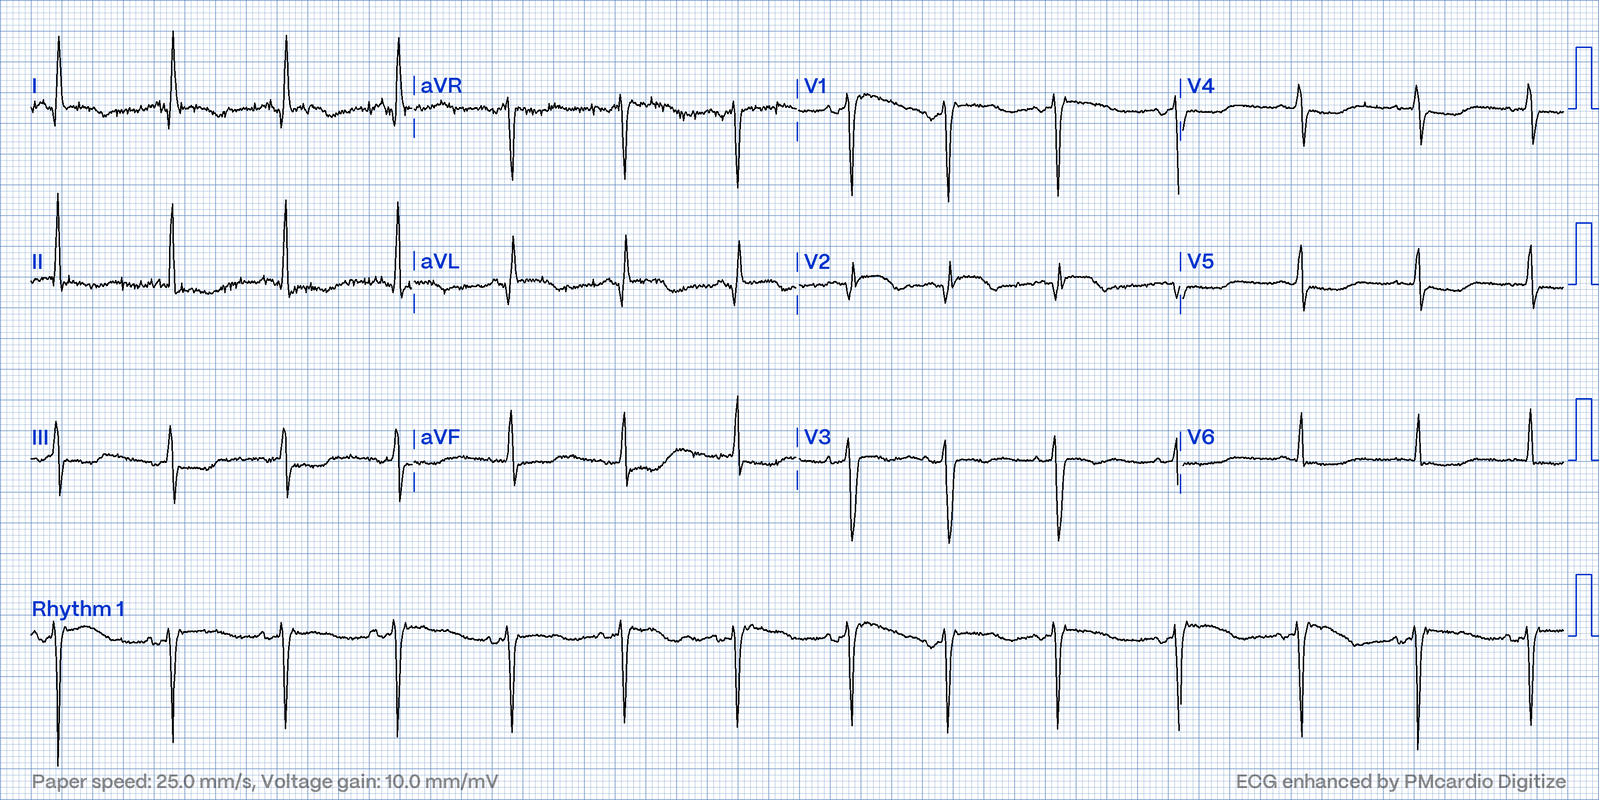
Downsloping depression: LVH with strain. The ST slides down into an asymmetric inverted T in the leads with the tallest R waves.
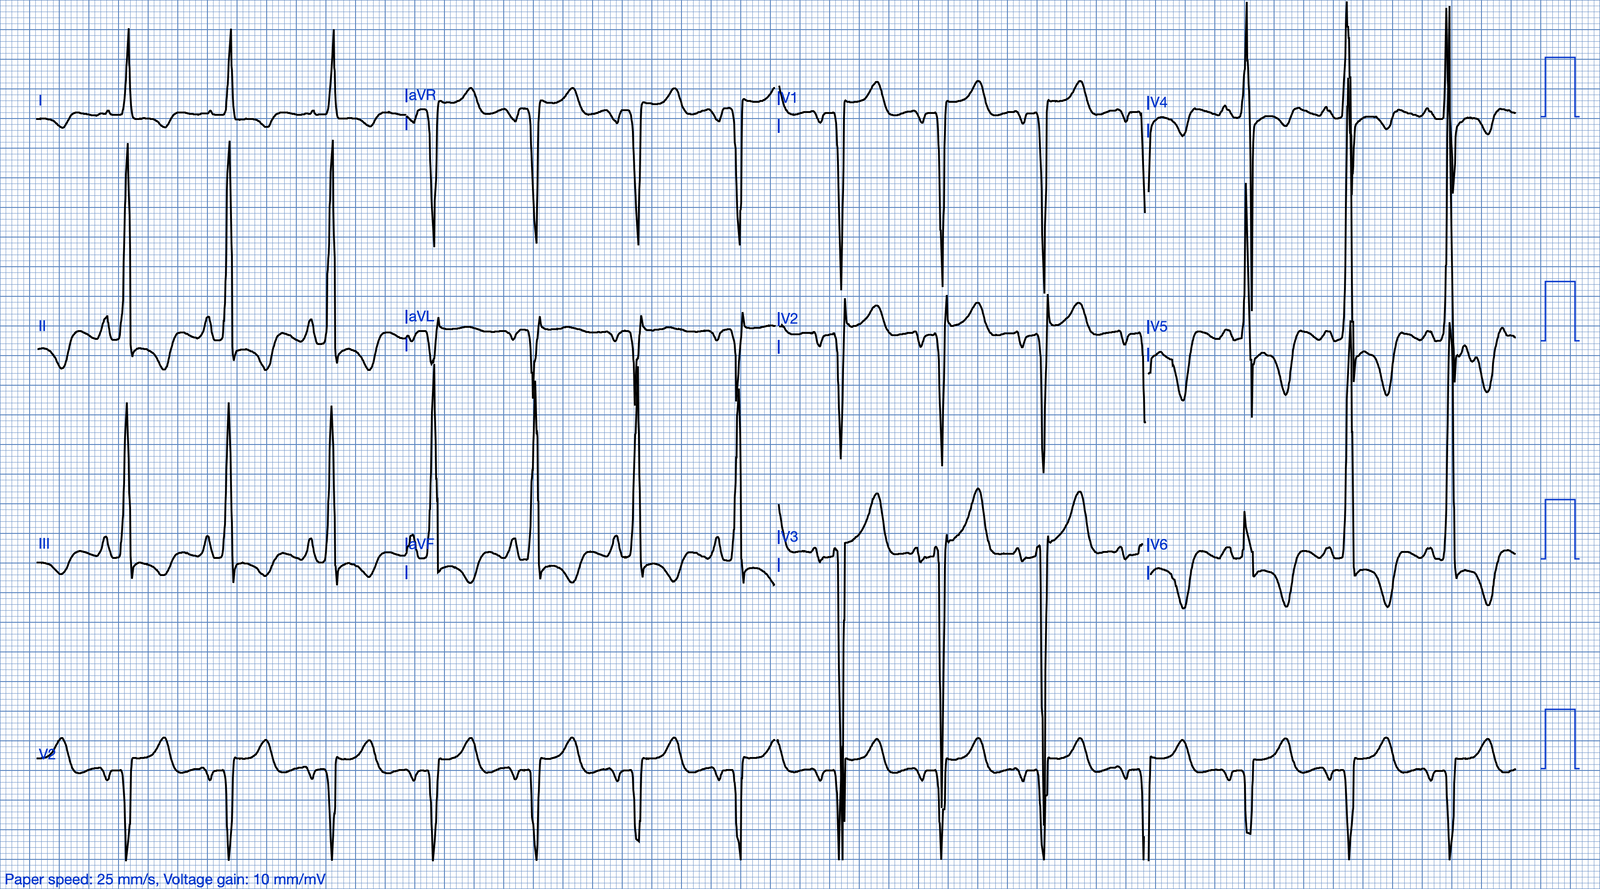
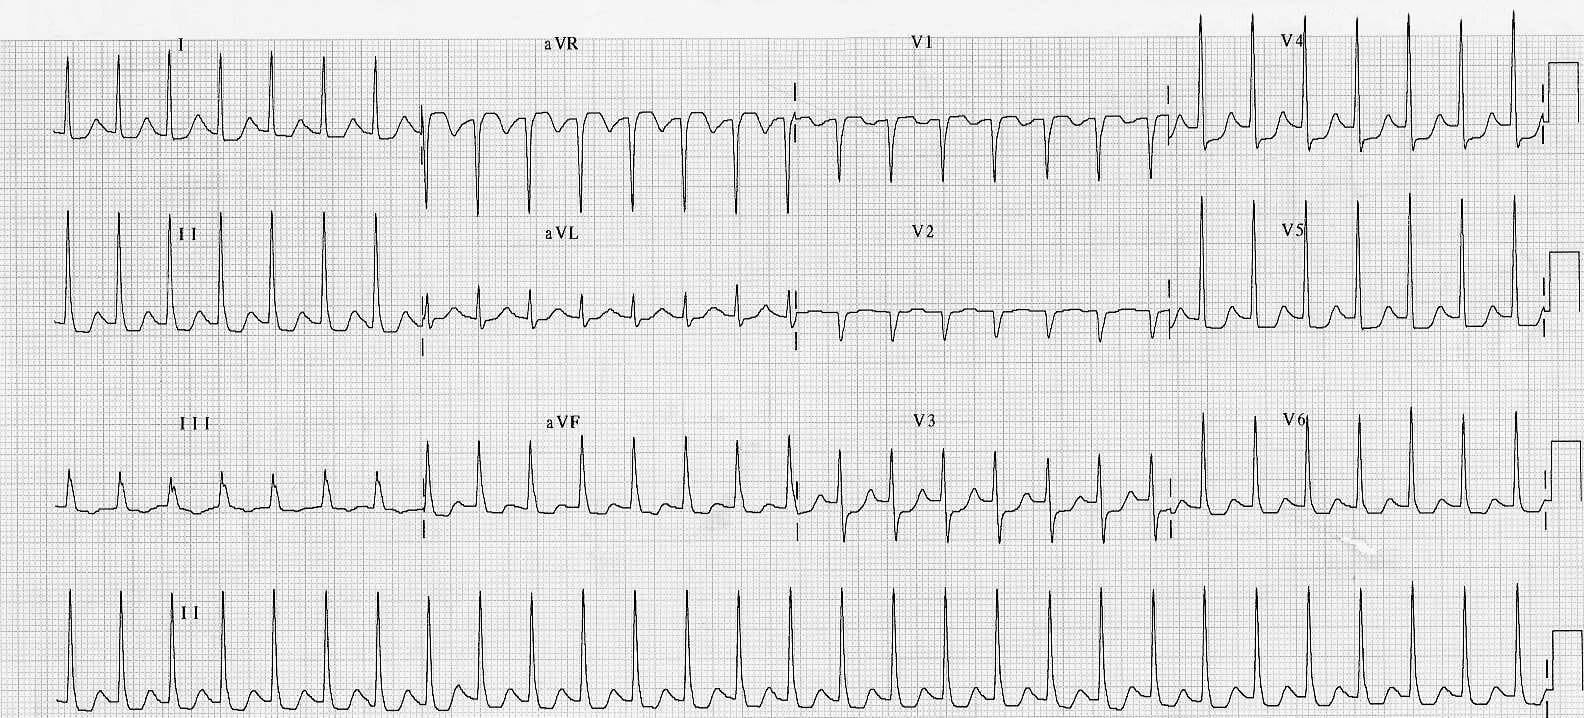
Diffuse depression from a fast rate. SVT with widespread ST depression. Reassess after the rate is controlled before calling it ischemia.
Scooped ("sagging") depression: digoxin effect. The ST droops in a smooth curve, often with a short QT and a long PR.
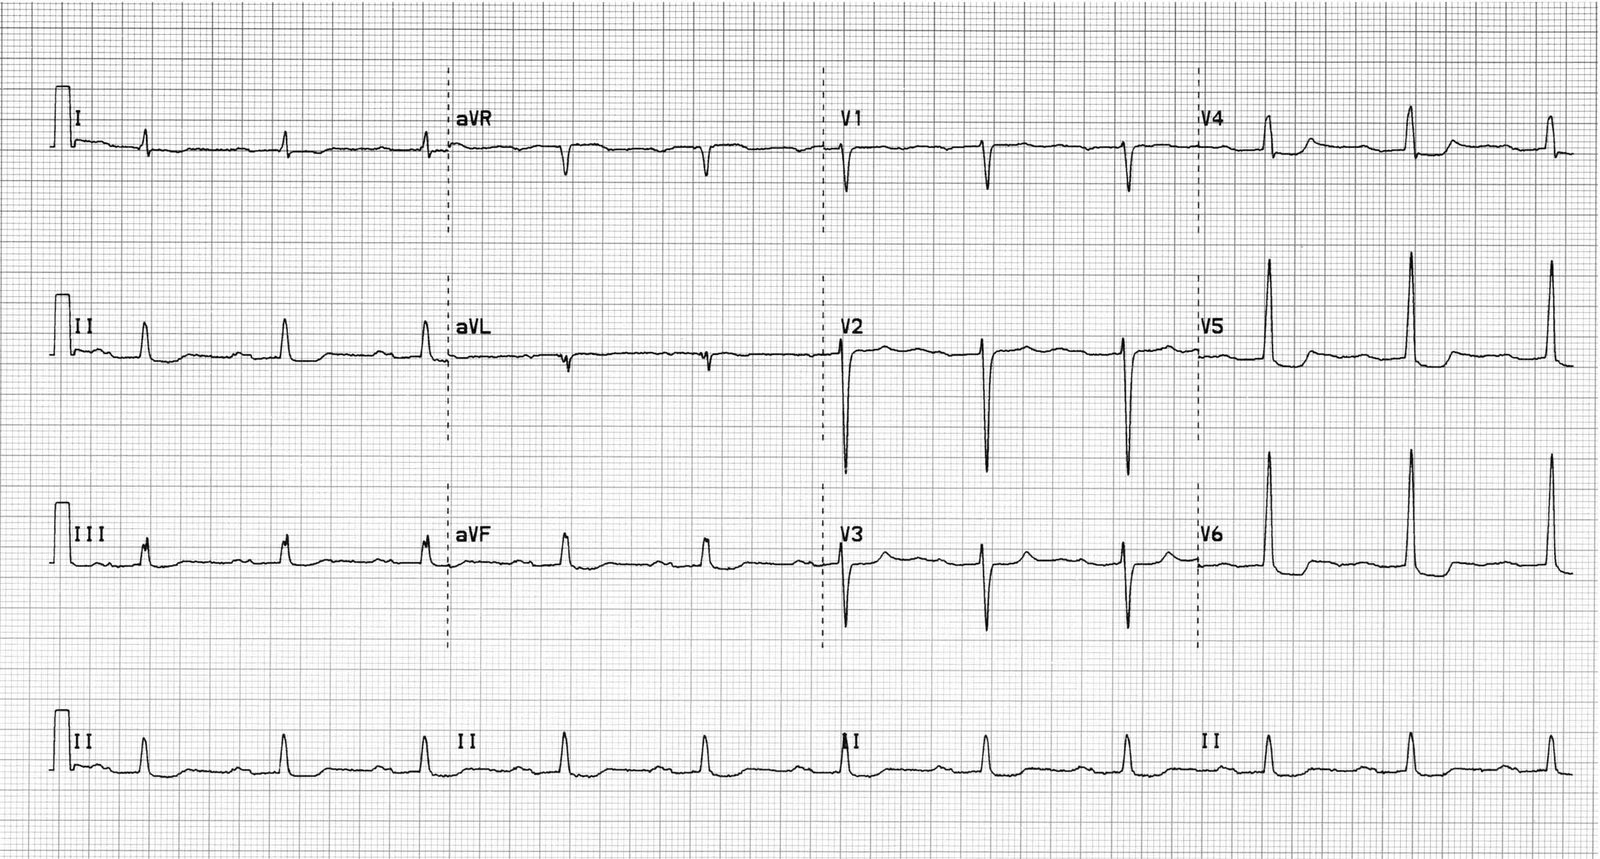
One odd lead? An abnormality in a single isolated lead is usually not significant on its own, so look at its neighbors.
4. The T Wave
T-wave assessment boils down to three things: shape, polarity and height.
Shape: Asymmetric Is Normal
A normal T wave climbs slowly and falls quickly. A symmetric T wave is pathologic until proven otherwise: think ischemia, electrolyte problems (especially high K⁺) and CNS events. Garcia notes that spotting symmetric T waves has caught many early MIs.
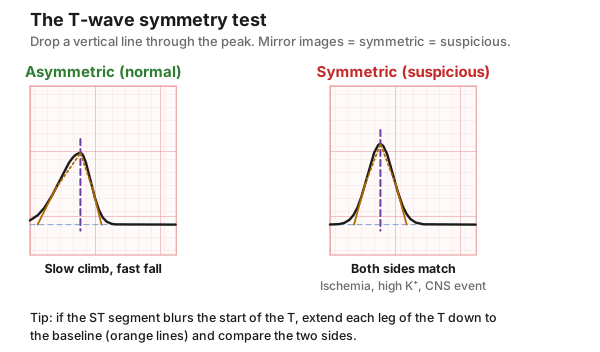
How to test it: put a straight edge vertically through the peak and compare the two sides. If the ST segment blurs where the T begins, extend each leg of the T down to the baseline as a straight line, then compare.
Polarity: Where Should It Point?
Lead | Normal T wave |
I, II, V3–V6 | Upright |
aVR | Inverted |
III, aVL, aVF, V1 (sometimes V2) | Variable; can be inverted and still normal |
Normal ECG
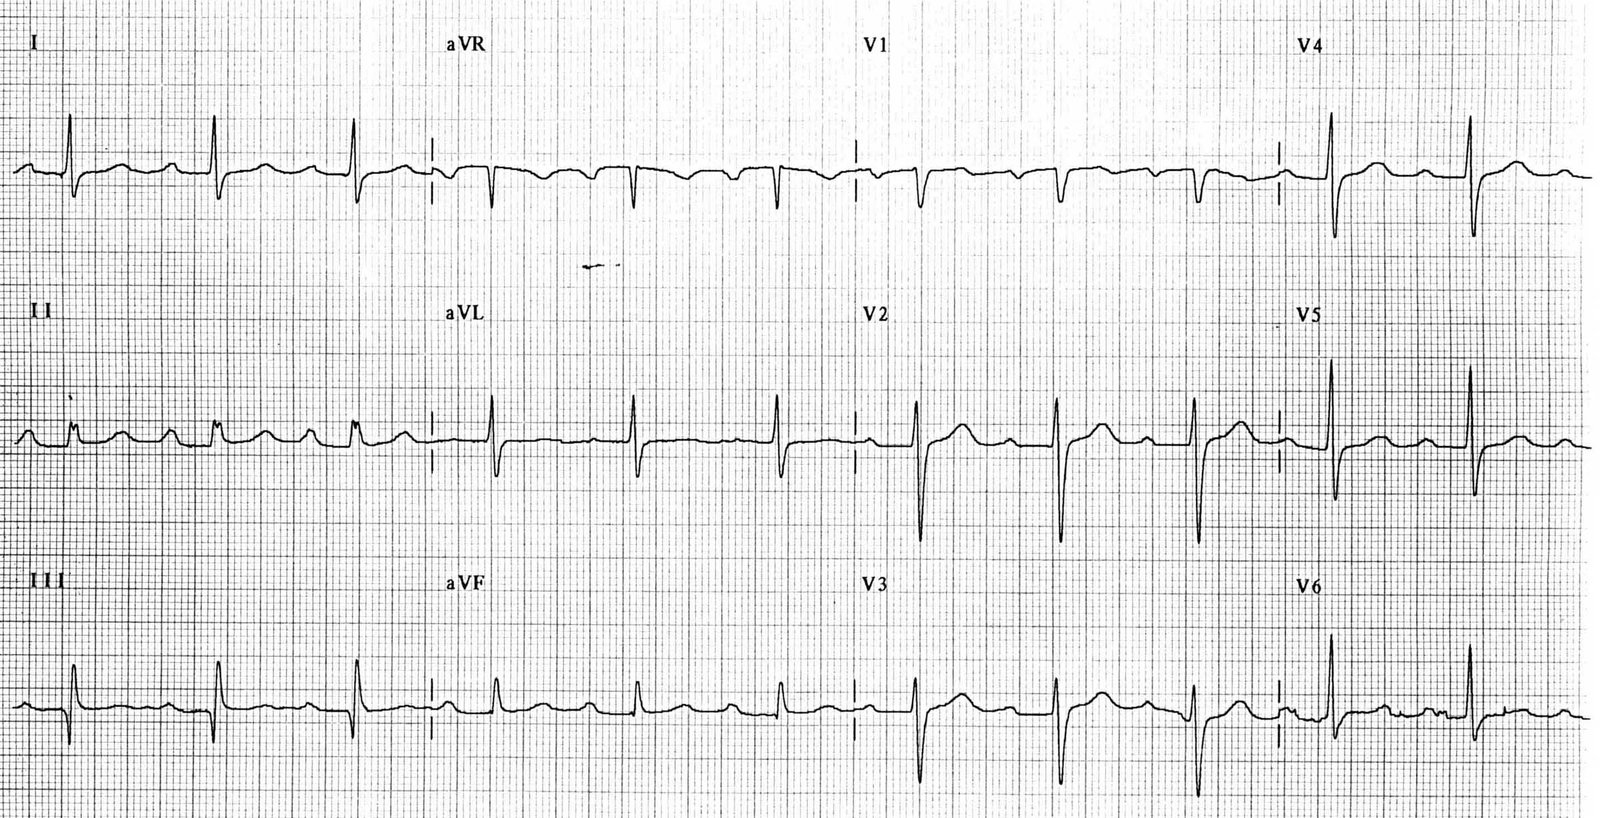
A T wave that is inverted where it should be upright (for example, lead II or V5) is called flipped. Flipped T waves can mean ischemia or severe ventricular hypertrophy. In a bundle branch block, these rules don't apply.
Real example: inversions that weren't an MI. An 18-year-old with cold symptoms whose T-wave inversions got him transferred to a cath center. Final call: a normal variant. Young patients, especially in the right precordial leads, can carry inverted T waves that are non-specific The old ECG and the story make the call, not the T waves alone.
Height and Variants
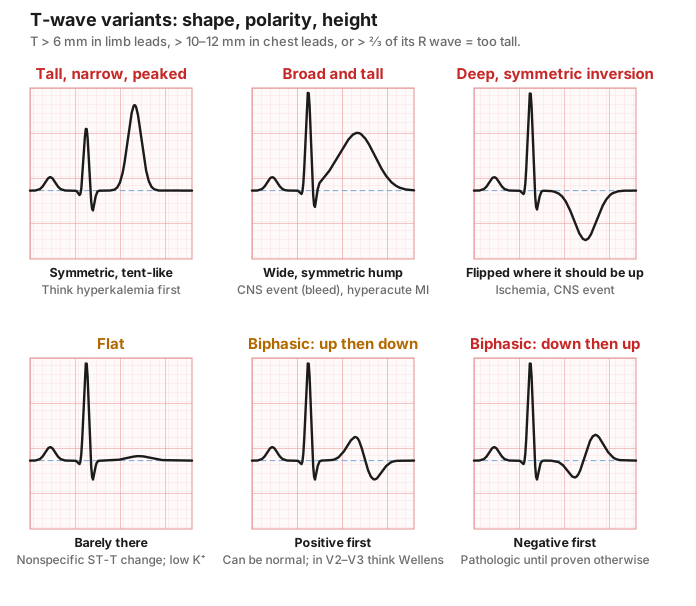
- Too tall: more than 6 mm in the limb leads or ≥ 12 mm in the chest leads (Garcia uses 12 mm), or more than ⅔ the height of its R wave.
- Tall, narrow, peaked, symmetric: hyperkalemia until proven otherwise. Check a potassium.
- Broad, bulky, symmetric: hyperacute T waves of an early STEMI, or a CNS event.
- Very broad, deep, symmetric inversions: may indicate ischemia, intracranial hemorrhage or major stroke ("cerebral T waves"), often with a long QT.
- Flat: nonspecific ST-T wave change (NSSTTWΔ); also low K⁺. Not normal, but not specific.
- Biphasic: common in transition leads. Garcia's rule: negative-then-positive is more likely pathologic. Think of a roller coaster: it should climb first, then drop.
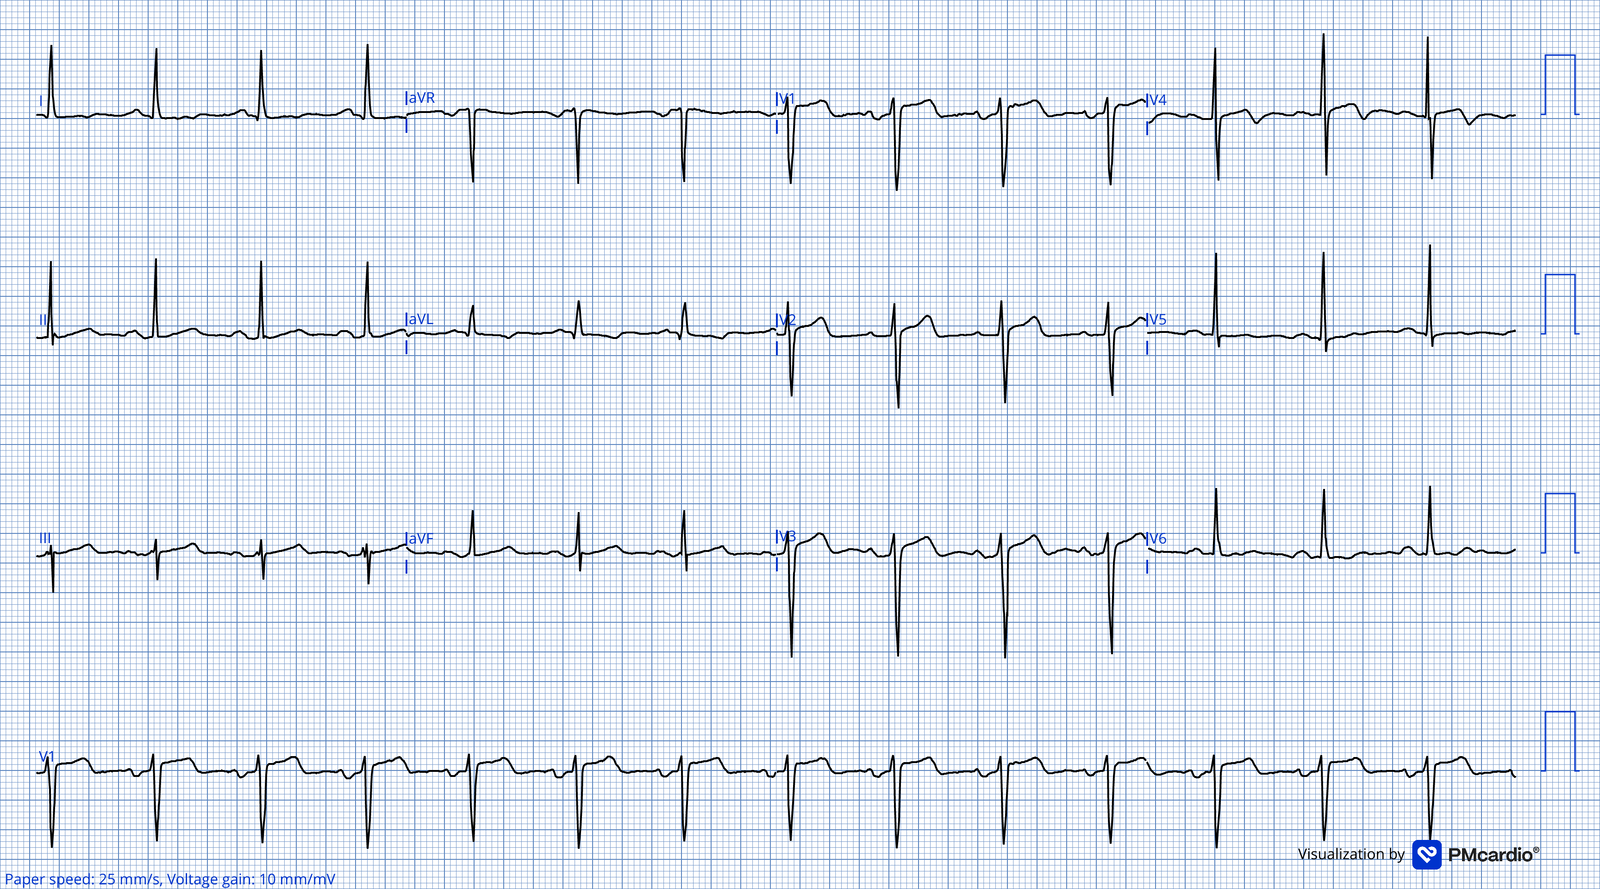
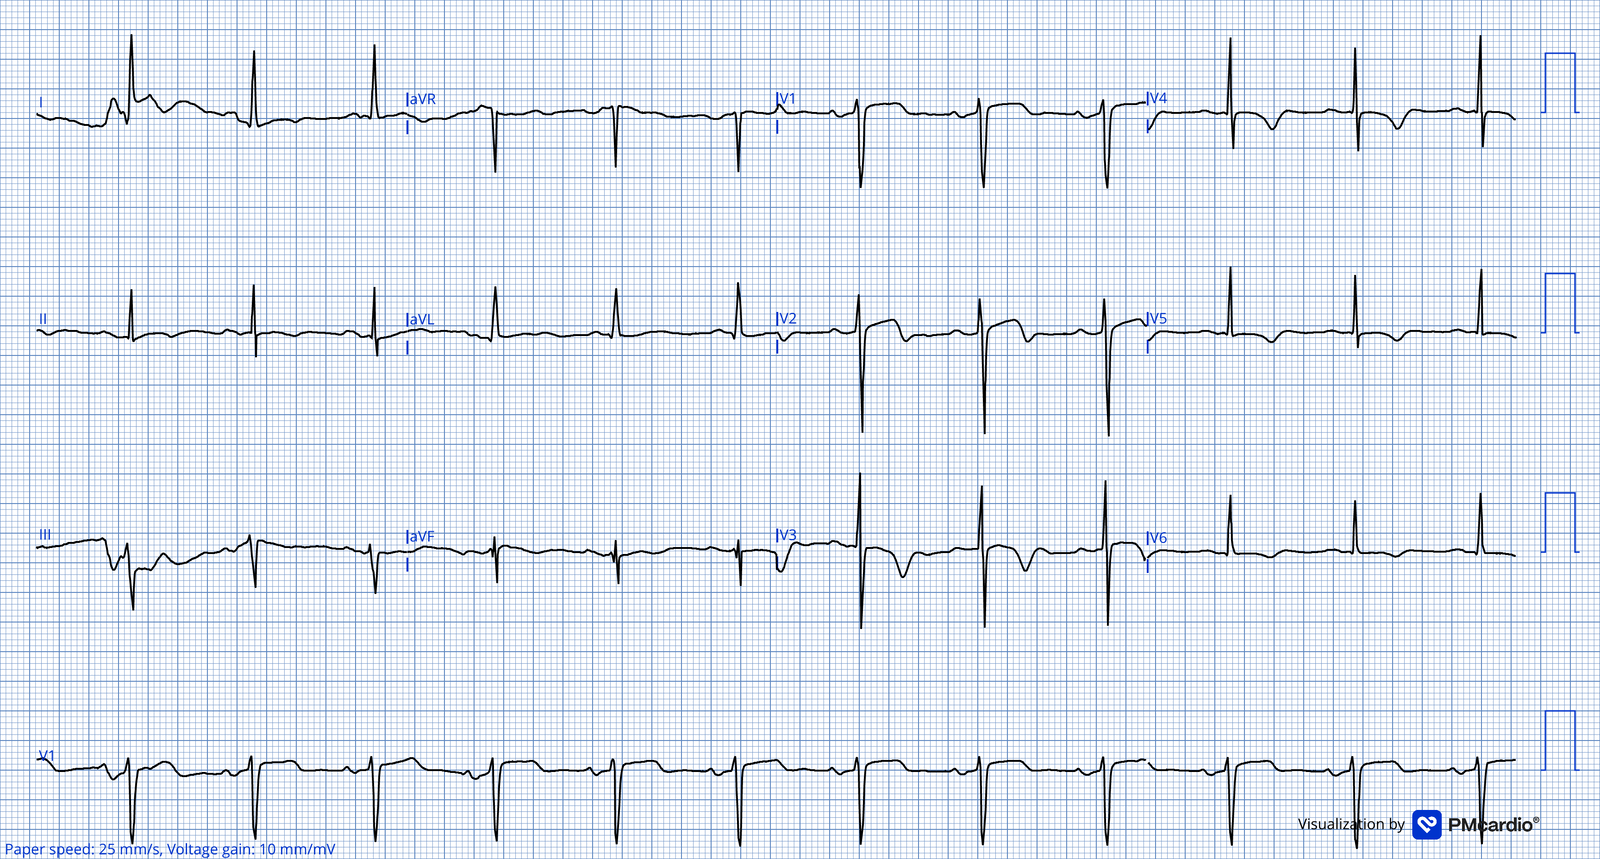
A positive-then-negative T wave in V2–V3 of a patient whose chest pain has settled, a positive-then-negative T is Wellens type A, a warning sign of a critical LAD lesion. Location and story matter.
Real example: Wellens. The first tracing was recorded during chest pain; the second, after the pain resolved. Look at V2–V3 on the pain-free ECG: that is where the warning lives.
Separating the T from its neighbors: intervals are the same in every lead. If the T is hard to see in one lead, measure where it starts and ends in a lead where it is clear, then carry that distance over with calipers. This also tells you whether a second hump is a U wave or a P wave hiding in the T.
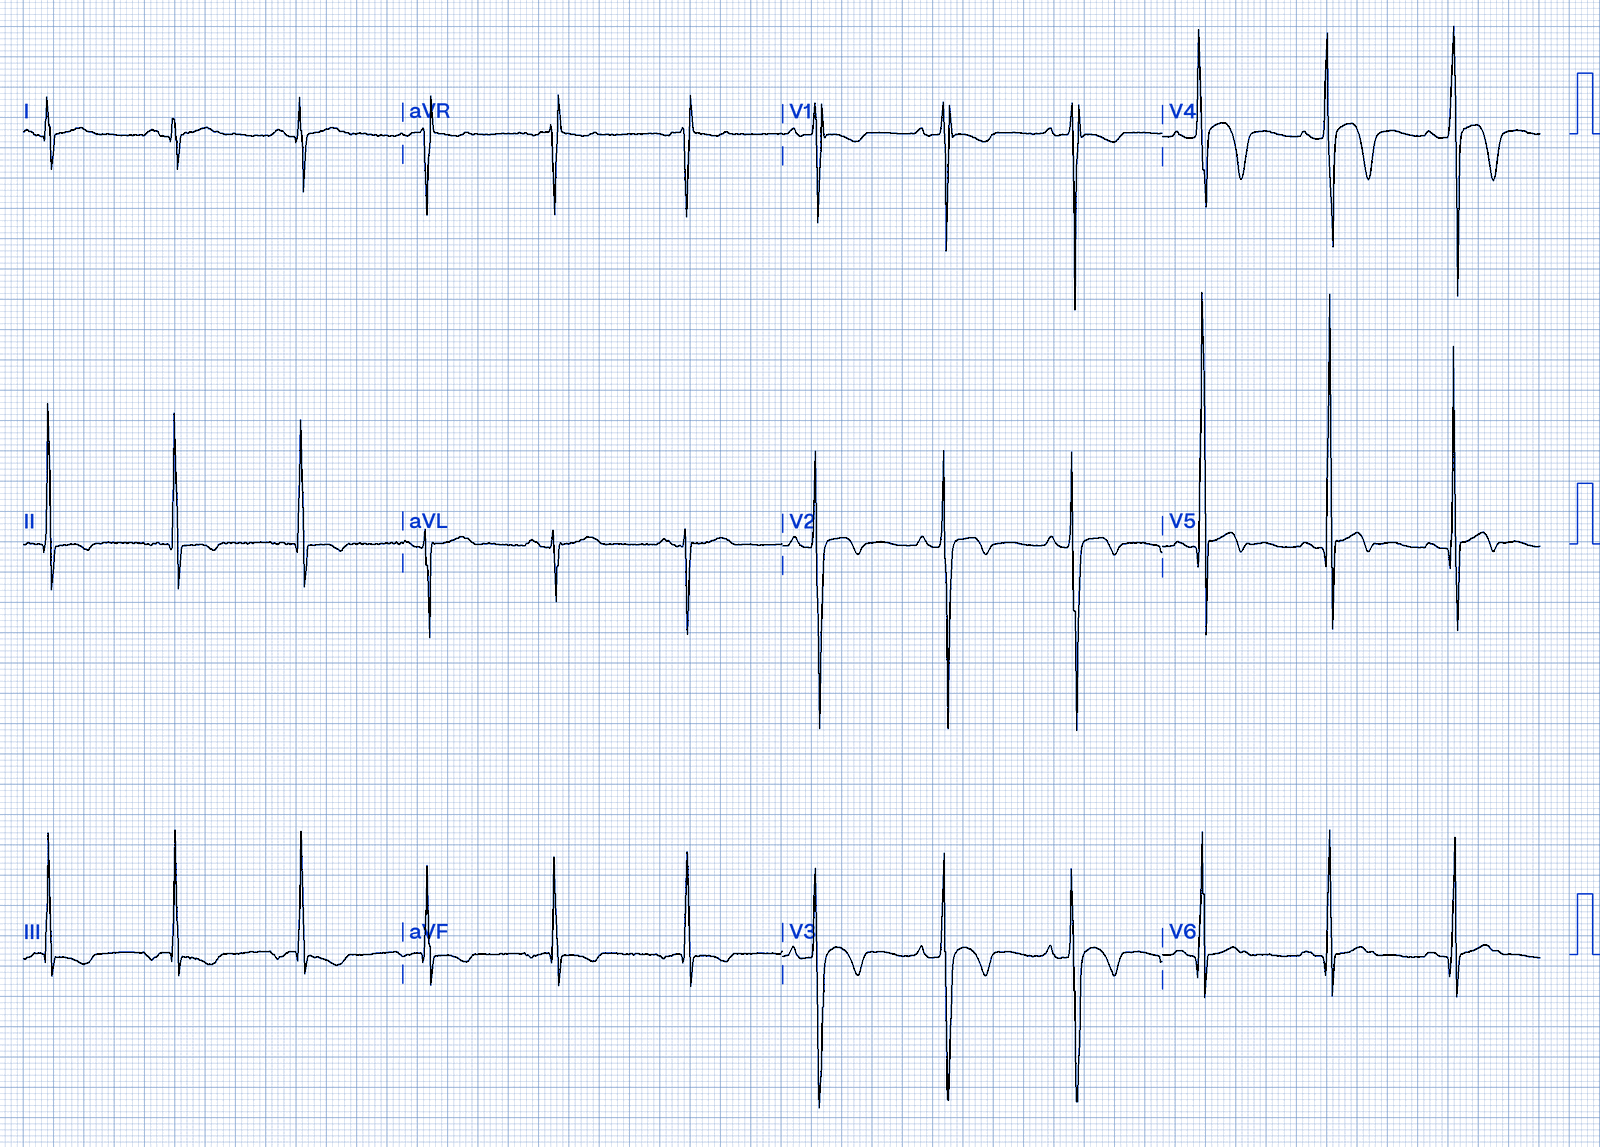
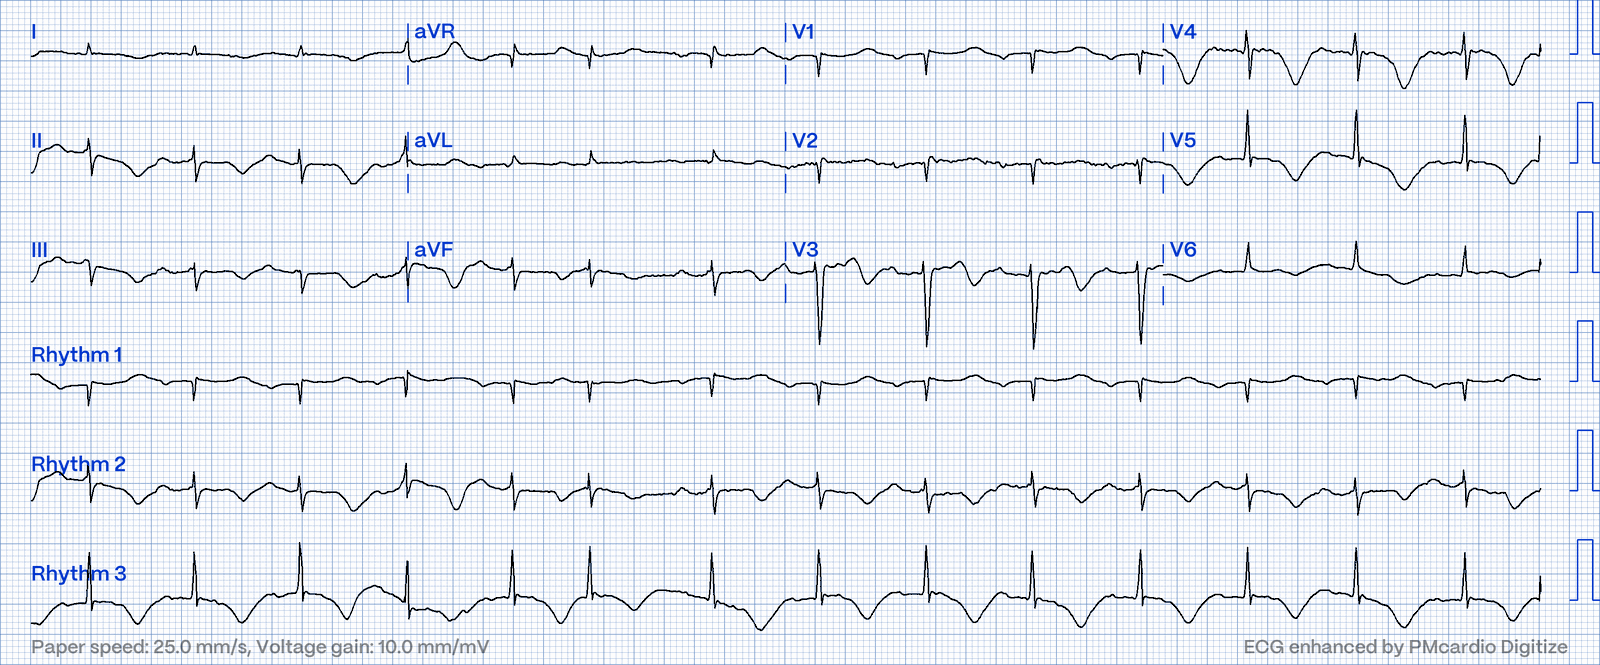
Real example: low potassium. Flattened and inverted T waves with prominent U waves, which make the QT look long (the machine often measures the QU instead).
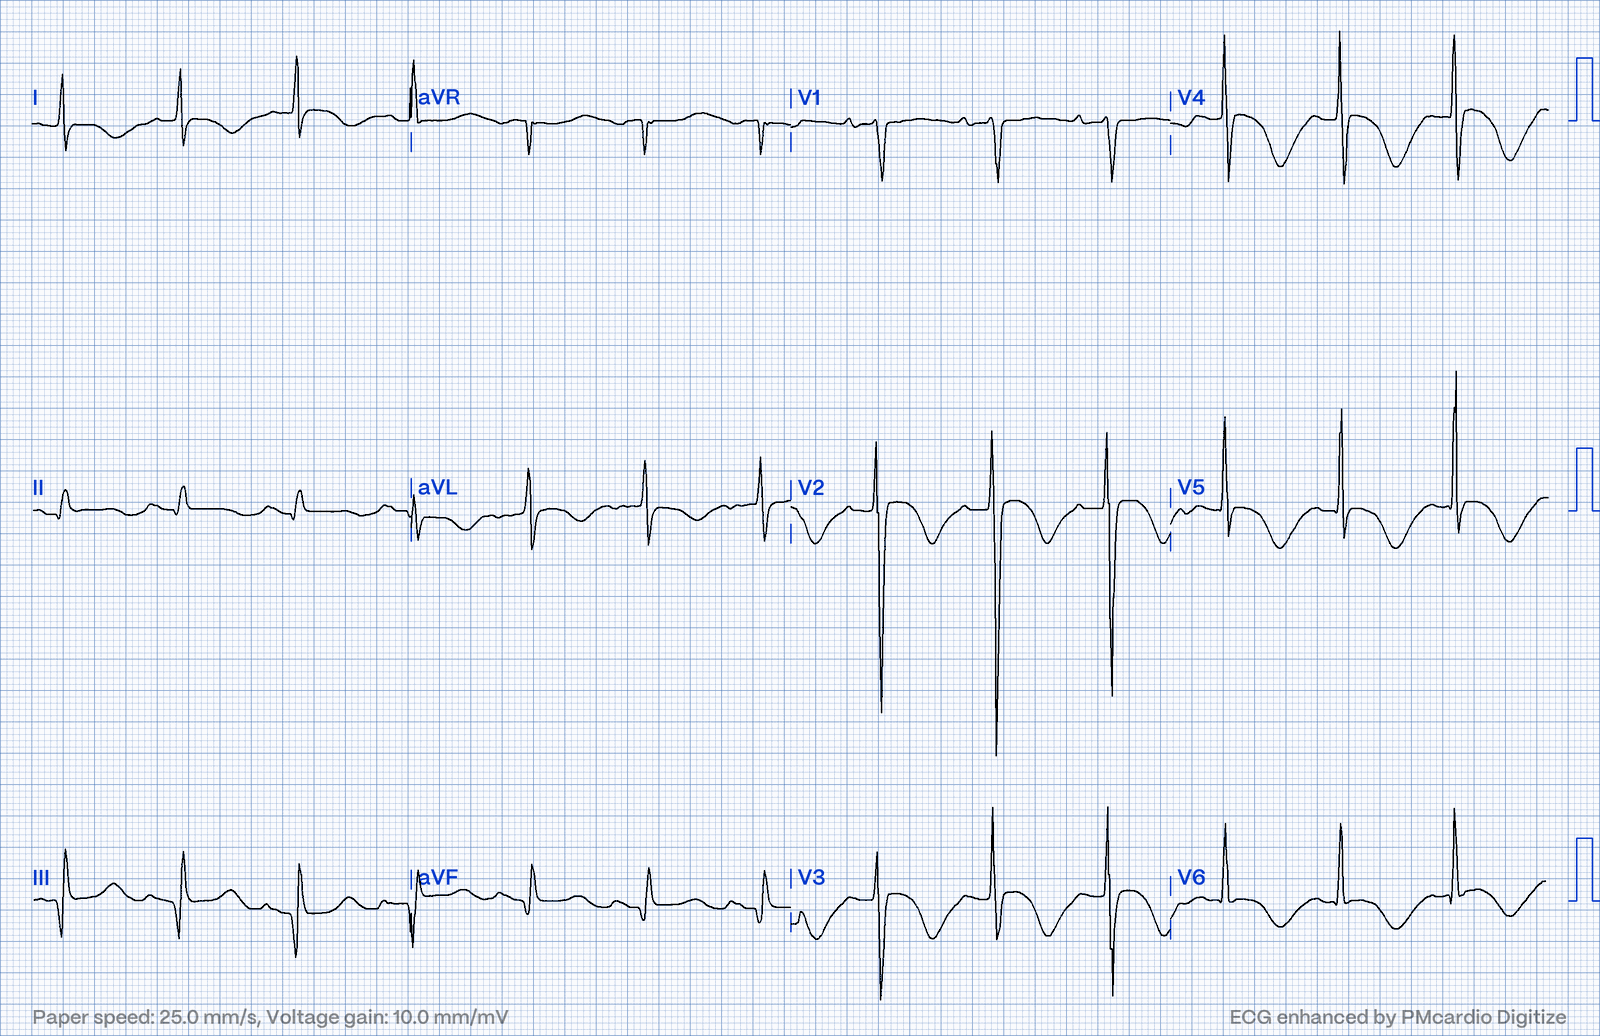
Real example: cerebral T waves. Deep, broad, symmetric T-wave inversions with a long QT in a patient with a large intracranial hemorrhage.
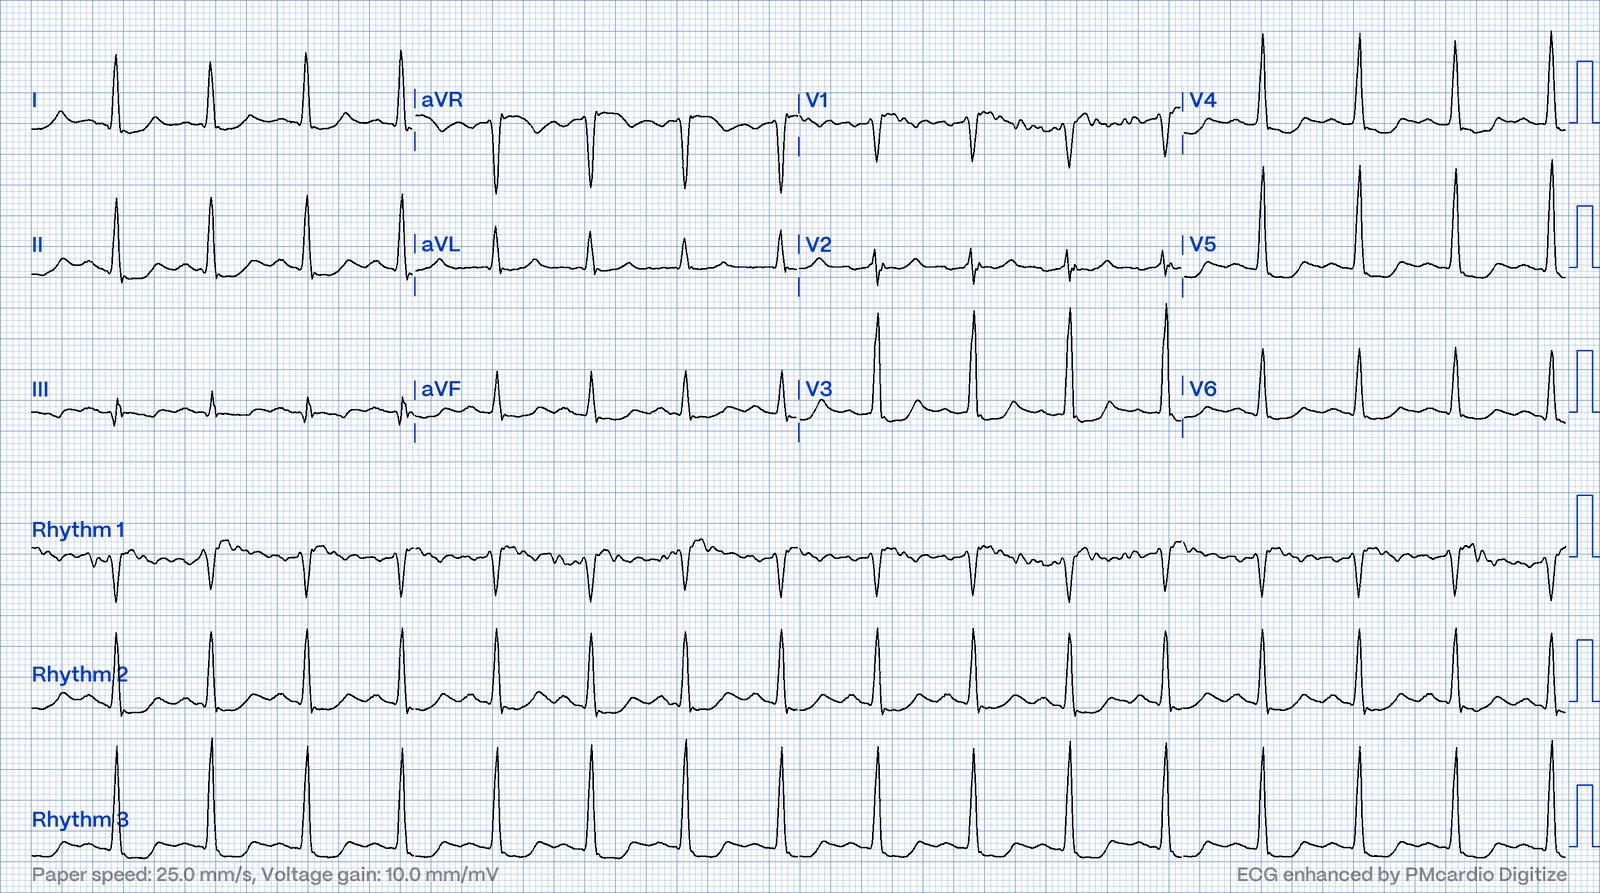
Real example: a cerebral-T mimic. Deep, symmetric T-wave inversions from a different cause: stress (Takotsubo) cardiomyopathy. Compare with the brain-bleed tracing above. The ECGs look alike; the story and the echo tell them apart.
5. Benign or Worrying?
The hardest call with the ST segment is deciding whether elevation is a normal variant or the start of an MI. No single feature settles it, but the pattern usually leans one way.
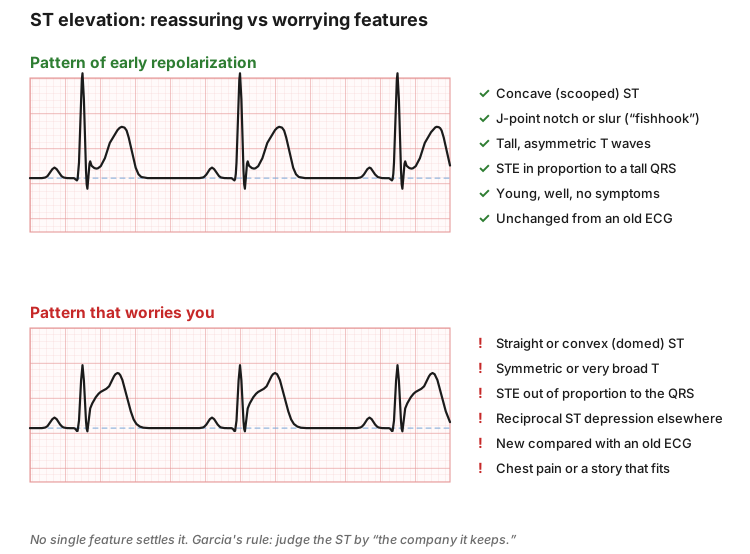
Leans benign (early repolarization pattern) | Leans worrying |
Concave, scooped ST | Straight or convex (domed) ST |
J-point notch or slur ("fishhook") | Symmetric or very broad T waves |
Tall but asymmetric T waves | ST elevation out of proportion to the QRS |
Most elevation in the lead with the tallest R wave | Reciprocal ST depression in other leads |
Young, asymptomatic, no change from an old ECG | New compared with an old ECG |
Diffuse, stable over serial ECGs | Chest pain, or a story that fits ischemia |
Notching isn't always benign. A notch at the end of the QRS usually points to early repolarization, but it also shows up in pericarditis and hypothermia. Young and well suggests early repolarization; pain that eases when sitting up suggests pericarditis; cold and confused suggests hypothermia.
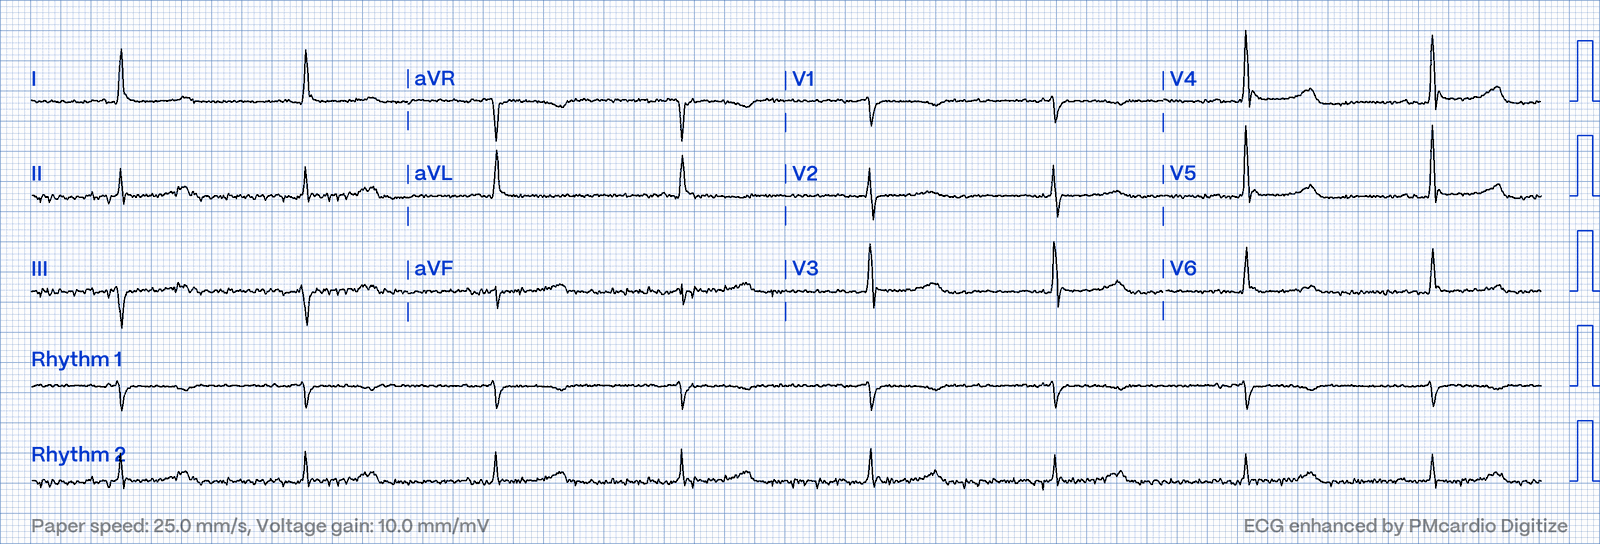
Don't Miss: "Early repolarization" is a diagnosis you make after you've ruled out the dangerous causes, not instead of it. In a patient with chest pain, get an old ECG and repeat the tracing.
High-Yield Pearls
- Measure from the J point to the TP baseline. Use the PR segment when the TP is hidden.
- Normal STE limits: < 1 mm in most leads; V2–V3 up to 2 mm (men ≥ 40), 2.5 mm (men < 40), 1.5 mm (women).
- Concave = leans benign. Straight or convex = worry. Tombstones need no old ECG to call.
- Asymmetric T is normal. Symmetric T is guilty until proven innocent.
- T taller than ⅔ of its R wave = abnormal.
- Tall, peaked, symmetric T → check the potassium.
- Very broad, deep, symmetric T inversions → think CNS bleed.
- T waves are inverted in aVR and can be normally inverted in III, aVL, aVF and V1.
- Biphasic T in V2–V3 after chest pain → think Wellens.
- "The company it keeps": always put the ECG together with the patient and an old tracing.
Quick Algorithm
- Baseline: draw it through the TP segments (or PR if needed).
- J point: sharp or diffuse? Above, below or on the baseline? How many mm?
- Shape: concave, straight or convex? Upsloping, horizontal or downsloping?
- T wave: symmetric or asymmetric? Upright where it should be? Too tall, too deep, flat or biphasic?
- Distribution: one lead, a group of neighboring leads, or diffuse?
- Context: old ECG, symptoms, potassium, neuro status.
- Call it: normal variant, nonspecific change, or worrying (see
 ECG Topic - Acute MI: Localizing the Infarct).
Practice - Benign or Bad?
Try each one before opening the answer.
Part A - Quick Calls
# | Finding |
A1 | 1.5 mm concave STE in V2–V3 with J-point notching, 24-year-old man, no symptoms |
A2 | 2 mm straight STE in V2–V4, 58-year-old woman with chest pain |
A3 | Tall, narrow, symmetric T waves in V2–V4 in a dialysis patient who missed a session |
A4 | Inverted T wave in aVR |
A5 | Biphasic T in V2–V3, positive then negative, in a patient whose chest pain resolved yesterday |
A6 | 2 mm upsloping ST depression in a patient with a heart rate of 150 |
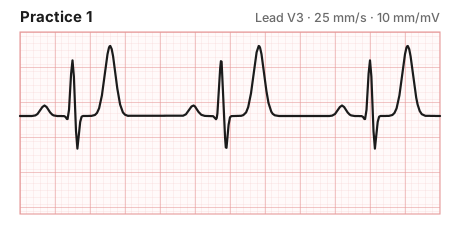
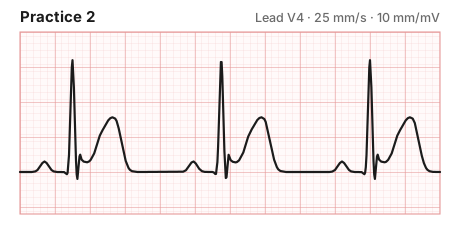
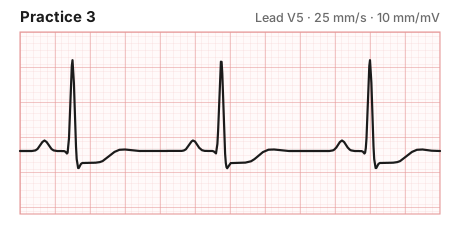
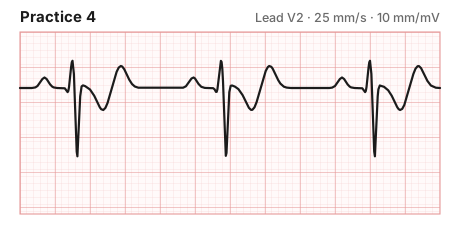
Part B - Read the Strip
Describe the ST segment and T wave, then decide: benign, nonspecific or worrying?
Part C - Real ECGs: Benign or Bad?
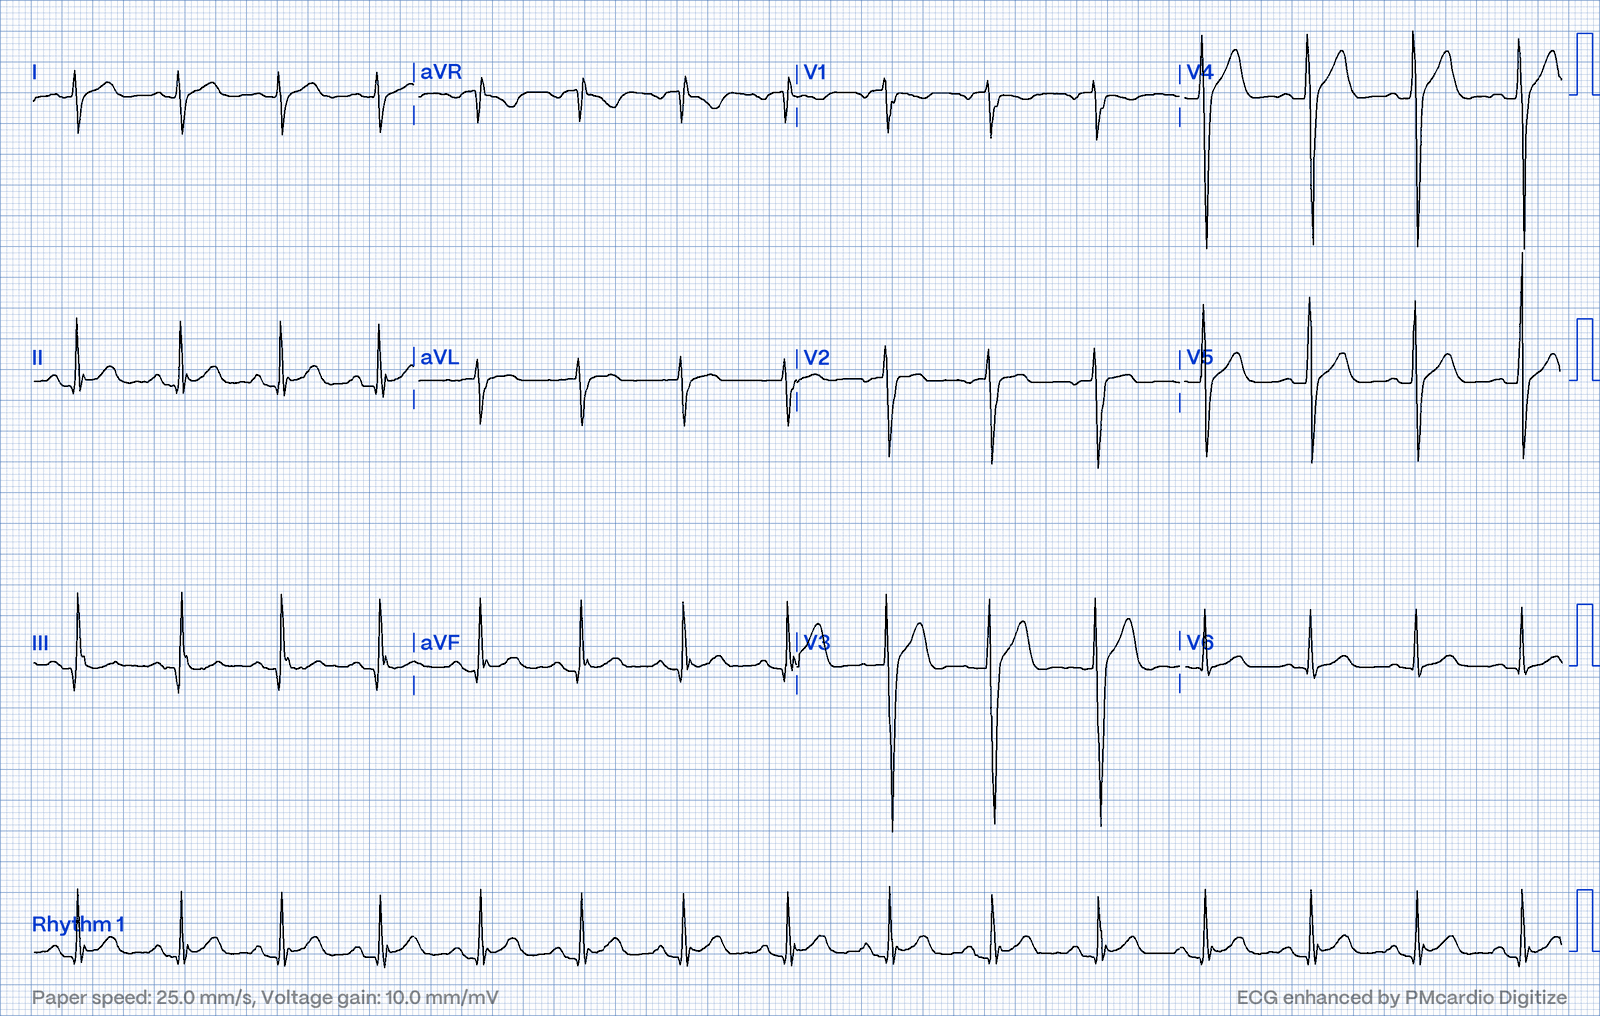
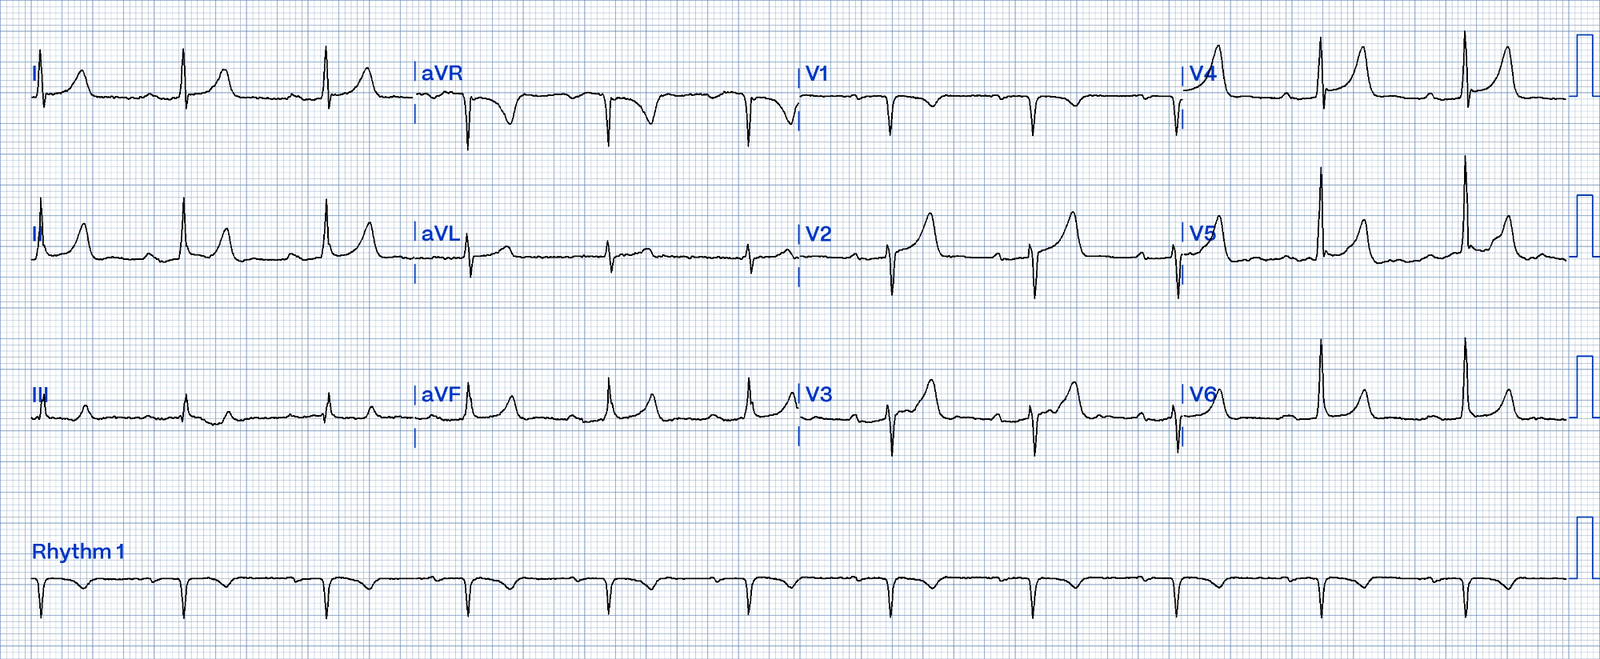
These come from the EM Rōnin ECG Bank. Read each one with the Quick Algorithm before opening the answer.
Case 1. 21-year-old with chest pain.
Case 2. Patient with end-stage renal disease.
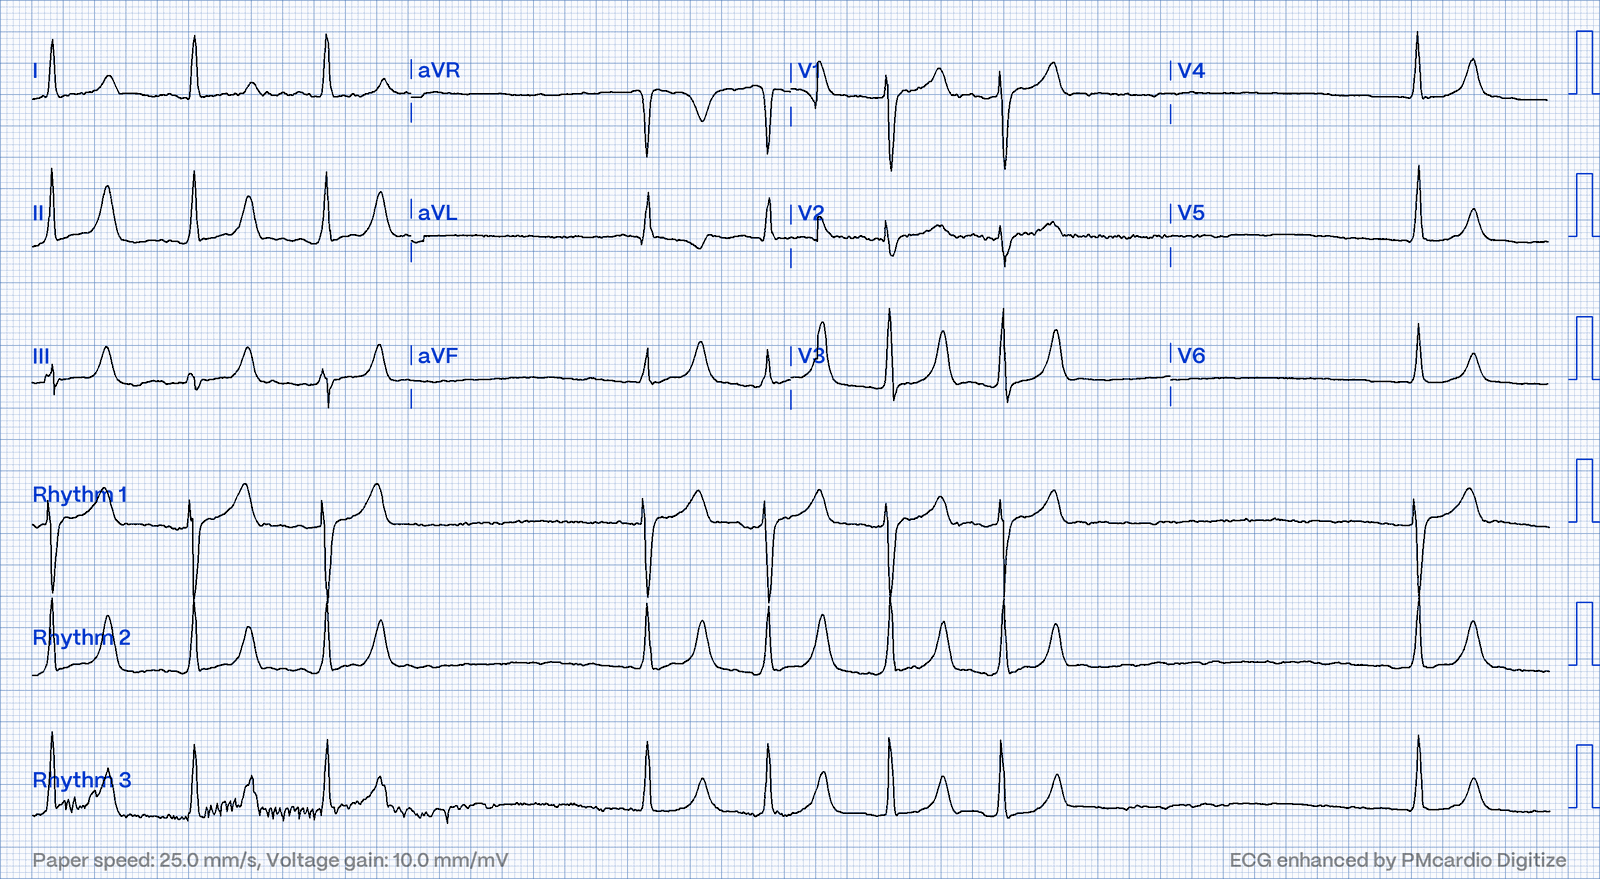
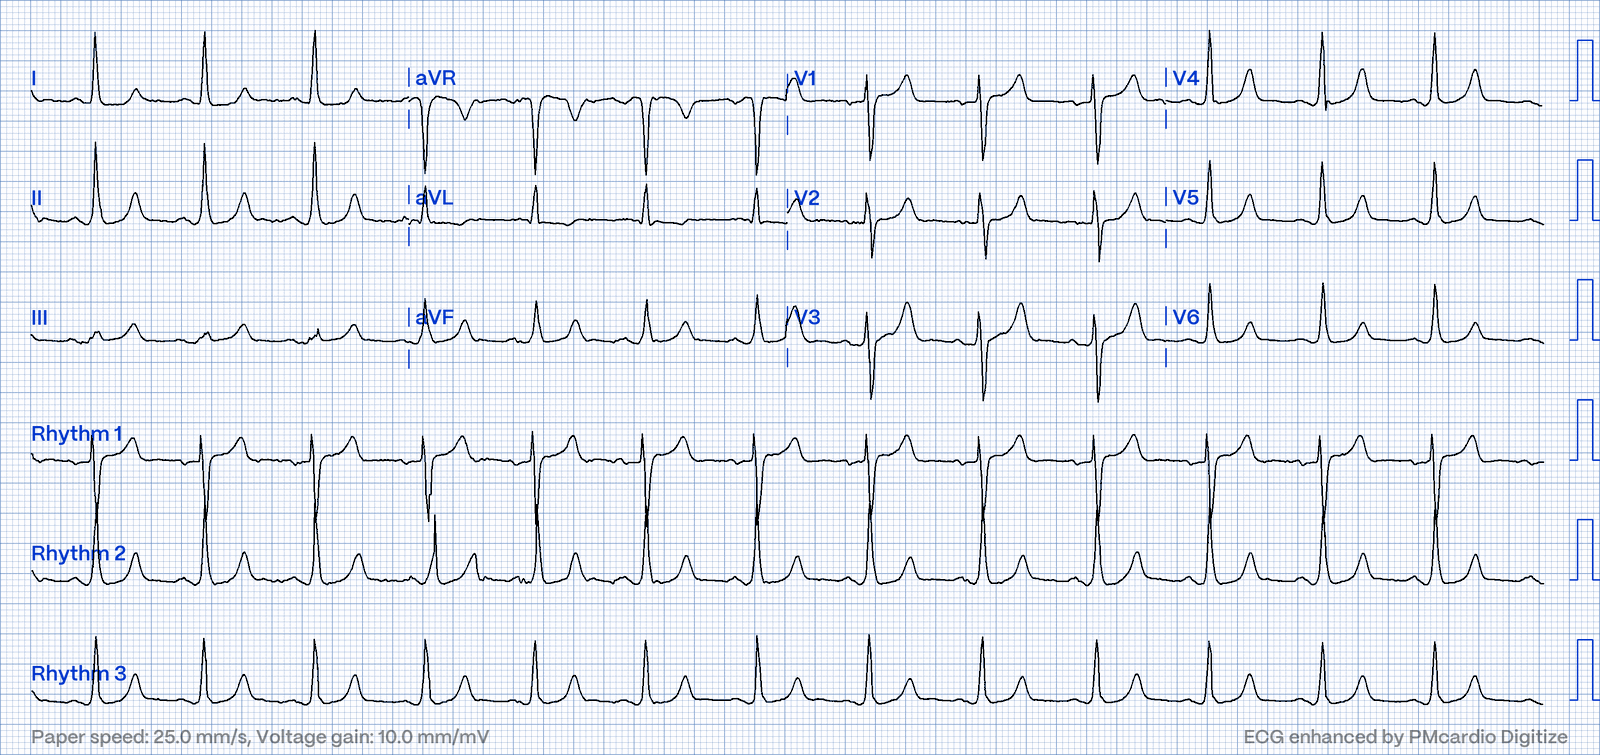
Case 3. Chest pain. Look carefully at the high lateral leads.
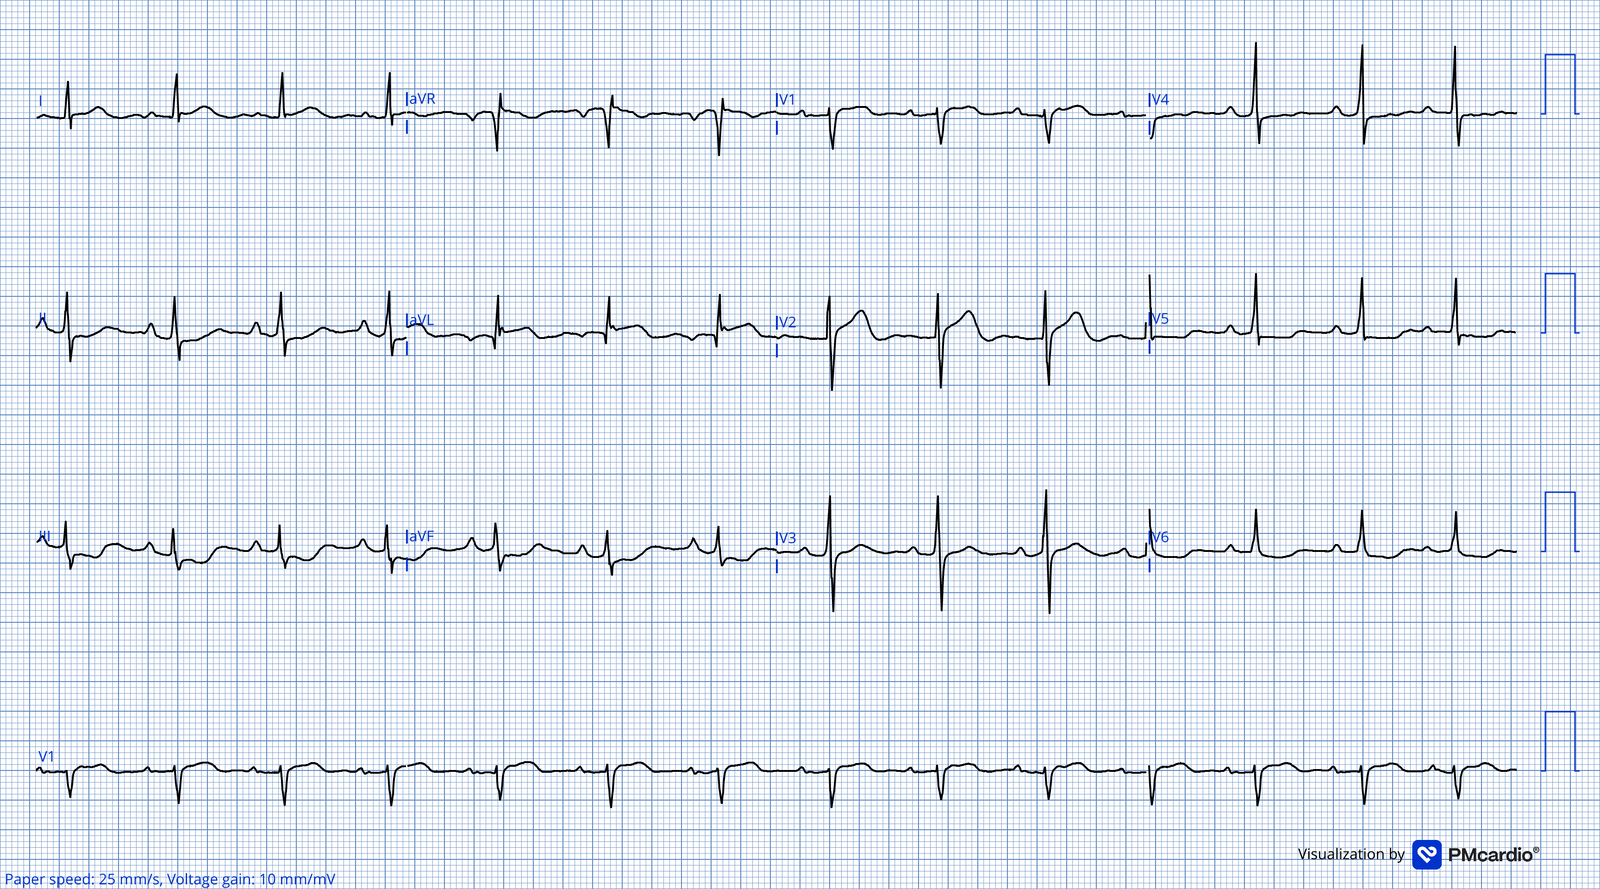
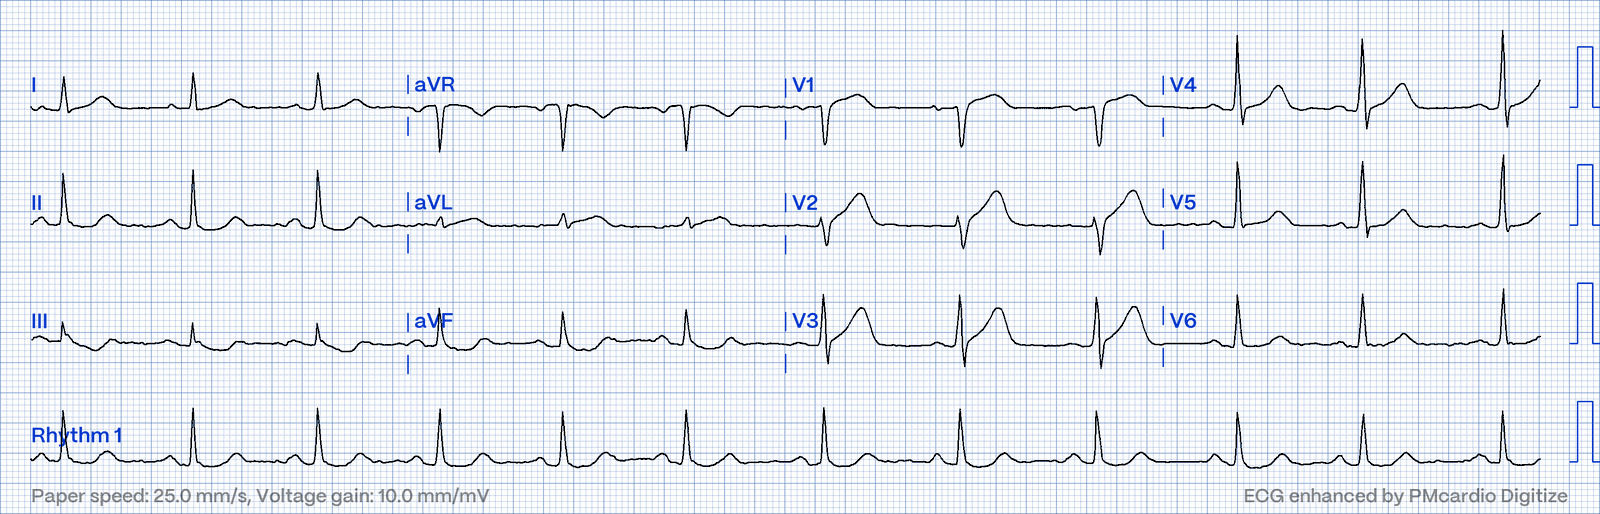
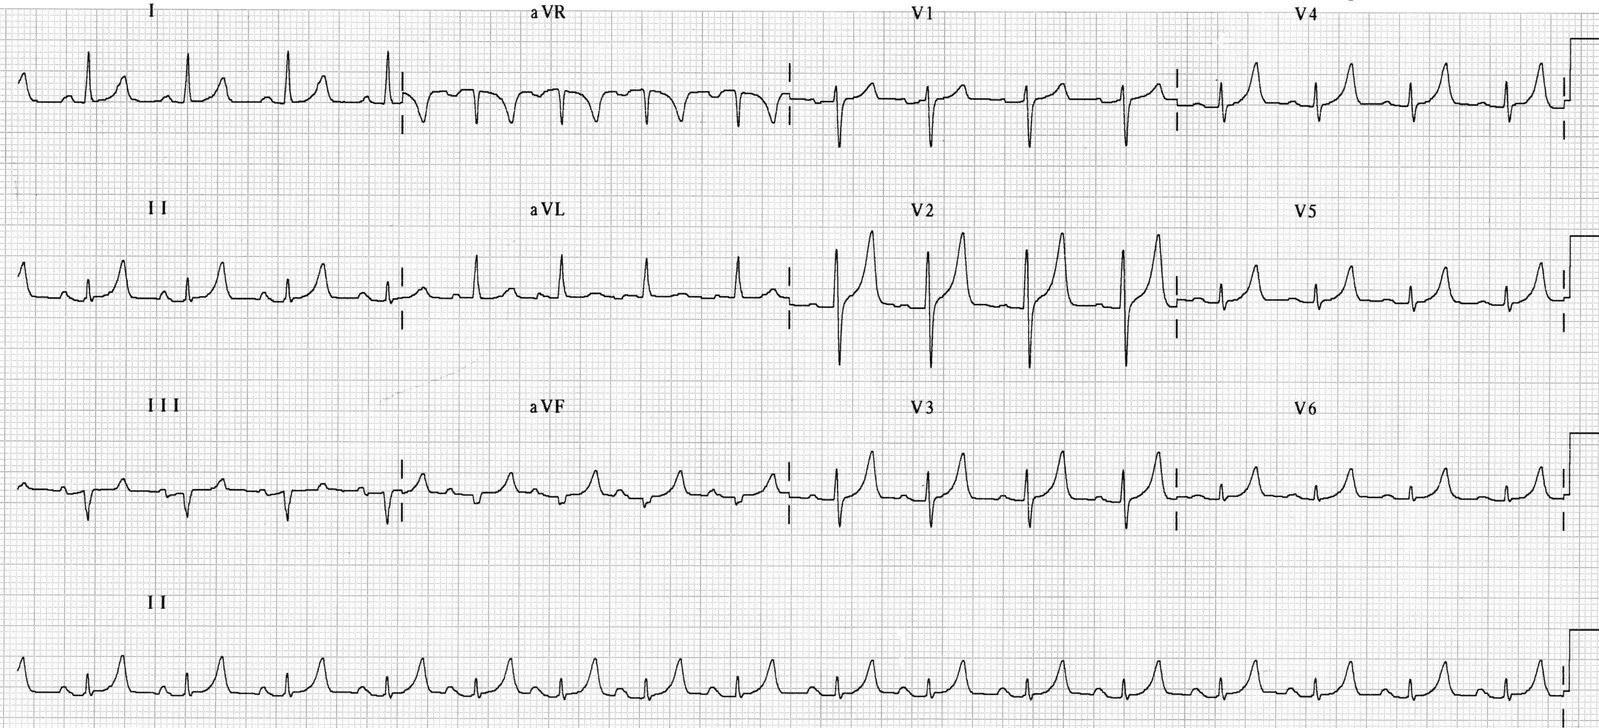
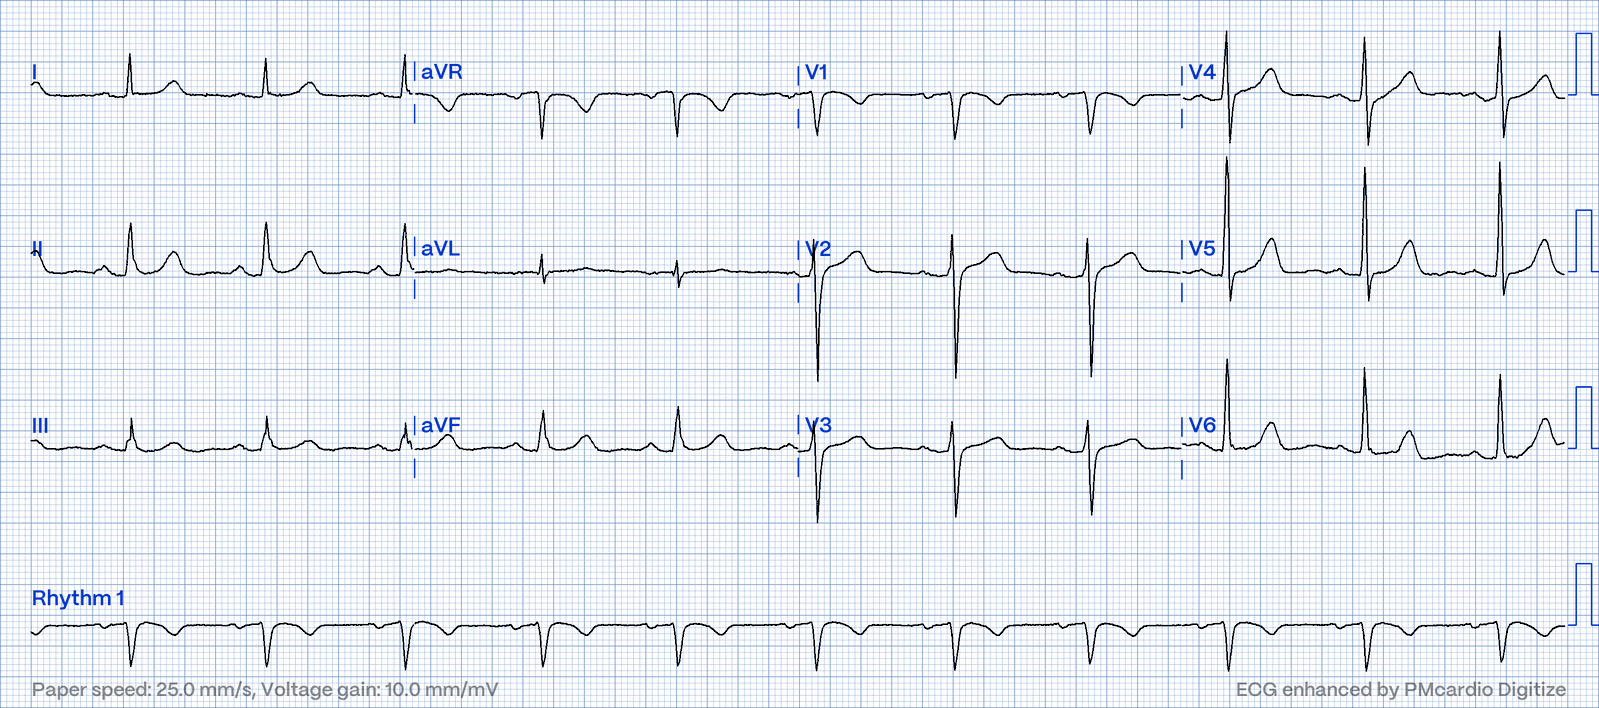
Case 4. Two patients, both with "big" anterior T waves. Which one has an occluded artery?
Part D - Concept Check
- What is the baseline for measuring ST deviation, and what do you use if it's hidden?
- Name three conditions with a diffuse J point.
- Which ST shape should make you think of STEMI first?
- How do you test whether a T wave is symmetric?
- In which lead is an inverted T wave always normal?
- A T wave is 9 mm tall and its R wave is 12 mm. Normal or abnormal?
- Give two causes of very broad, symmetric T waves.
Sources
- Garcia TB. 12-Lead ECG: The Art of Interpretation. 2nd ed. Burlington, MA: Jones & Bartlett Learning; 2015. Chapter 14, ST Segment and T Waves.
- Thygesen K, Alpert JS, Jaffe AS, et al. Fourth Universal Definition of Myocardial Infarction (2018). Circulation. 2018;138:e618–e651.
- de Zwaan C, Bär FW, Wellens HJ. Characteristic electrocardiographic pattern indicating a critical stenosis high in left anterior descending coronary artery in patients admitted because of impending myocardial infarction. Am Heart J. 1982;103(4 Pt 2):730–736.
This post is for education and not medical advice.